
You make a curved graph straight by adjusting only the horizontal axis: x squared, one divided by x, one divided by x squared, or the square root of x. The vertical axis and your measured values stay as they are. You get a straight line through the origin, and its gradient is almost always a physical quantity.
This video can also be listened to in العربية, English, Español, Français, Português and Türkçe. There are also subtitles in Kiswahili. Choose your language under the gear icon in the player, at Audio track and Subtitles.
You have a curved graph and you change none of your measurements. You only change what goes along the horizontal axis, and then it is straight. That is not a trick: from a straight line through the origin you get the constant with two points and a ruler, while on a curve you have to guess which point to take.
In this video you learn how to make a curved graph straight. You adjust only the quantity along the horizontal axis, never the vertical one. If the relationship is proportional to the square you put x squared there, if it is inversely proportional one divided by x, if it is inversely proportional to the square one divided by x squared, and for a square-root relationship the square root of x. In all four cases you get a straight line through the origin.
Then you work with it. Five measured points of a fall give a curve; put the time squared along the axis and a straight line appears. Its gradient is four point nine, and that is not just a number: since h equals one half g times t squared, what stands before x is one half g, so the acceleration due to gravity is double that. Anyone who writes down four point nine has forgotten that half.
And what do your measured values do while all this happens? Nothing. You convert them and put them somewhere else along the axis, but what you measured is still what you measured.
For upper secondary physics, in the basic skills.
In this video
The full explanation, in writing
I change none of my measurements
0:00I have a curved graph. I change none of my measurements. I only change what goes along the horizontal axis. And then it is straight.
Why a curve is awkward
0:13First, why would you want this? With a straight line you see at a glance that it is straight, and you get the constant out with two points and a ruler. With a curve you can do neither. You cannot see straight away which curve it is, because four different relationships give four curves that look alike to the eye.
0:35And you do not know which point to take to determine the constant as precisely as possible.
The four adjustments
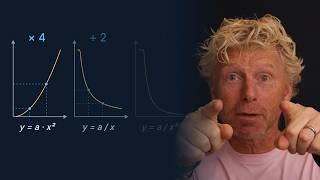
0:43The trick is this: you adjust the quantity along the horizontal axis, and you change nothing on the vertical axis. Proportional to the square? Then on the horizontal axis you put not x but x squared. Inversely proportional? Then you put one divided by x.
1:02Inversely proportional to the square? Then one divided by x squared. And with a square-root relationship you put the square root of x. In all four cases you get a straight line through the origin. That is what linearising a graph means. And note: your measured values do not change.
1:25You convert them, you put them somewhere else along the axis, but what you measured is still what you measured. You have an inverse square relationship. What do you put on the horizontal axis?
Falling, and what the gradient means
1:41Now to work with it. I drop something and measure how far it has fallen after a certain time. After zero point two seconds, zero point two zero metres. After zero point four, zero point seven seven. After zero point six, one point seven five.
1:57Zero point eight, three point one seven. And after one second, four point eight eight metres. If I plot the height against the time, I get a curve. If I double the time from zero point four to zero point eight, the height goes from zero point seven seven to three point one seven, and that is four times as much. So square.
Changing the axis, and what comes out
2:24Then on the horizontal axis I put the time squared. Zero point zero four, zero point one six, zero point three six, zero point six four, and one. Now it is a straight line through the origin. I take the gradient from two points that lie far apart: four point eight eight minus zero point two, divided by one minus zero point zero four.
2:49That is four point nine. And there is the physics. The height is one half g times t squared, so that gradient is half the acceleration due to gravity. So the acceleration due to gravity is double: nine point eight metres per second squared. If you end up with four point nine, you mistook the gradient for the acceleration due to gravity and forgotten that half.
Three things to remember
3:15Three things. You make a curve straight by adjusting only the horizontal axis: x squared, one divided by x, one divided by x squared, or the square root of x. Your measured values do not change while you do it. You convert them. And the gradient of that straight line is almost never just a number.
3:36Look at what stands before the x in your formula, because that is what you measured.
Two questions
3:42Two questions. One. You make a graph straight and it becomes a neat straight line, but it cuts the vertical axis above zero. What do you know then? Two. Root x on the horizontal axis and your graph stays curved. What do you do now?
The answers
4:01The first: then the relationship is not purely square or root, but something fixed is added on top. Exactly like that table under my stack of books. The shape is right, but there is a b. The second: then you chose the wrong relationship. Go back to your two points, double your x, and look again at what y does.
4:23The shape you find determines the adjustment.
The basic skills complete
4:27With that you have all the basic skills together: measuring, calculating, units, uncertainty, relationships. From here on we will use them.
Frequently asked questions
What does linearising a graph mean?
You put a converted form of the quantity along the horizontal axis rather than the quantity itself: x squared, one divided by x, one divided by x squared, or the square root of x. You leave the vertical axis alone. If the relationship you chose is right, the curve becomes a straight line through the origin.
Why would you want to make a curved graph straight?
For two reasons. From a straight line you get the constant with two points and a ruler, while on a curve you have to guess which point to take. And you cannot see from a curve which relationship it is, because four different relationships give four curves that look alike to the eye.
What do you put on the horizontal axis for an inverse square relationship?
One divided by x squared. For a relationship proportional to the square you put x squared, for an inversely proportional one, one divided by x, and for a square-root relationship the square root of x.
Do your measured values change when you linearise a graph?
No. You convert them and put them somewhere else along the axis, but what you measured stays what you measured. No measurement disappears and none is added.
Why is the gradient of an h against t squared graph not the acceleration due to gravity itself?
Because h equals one half g times t squared. What stands in front of the horizontal quantity is one half g, and that is what the gradient measures. If you find four point nine, the acceleration due to gravity is double that: nine point eight metres per second squared. Anyone who writes four point nine has forgotten that half.
Before this came recognising relationships and determining the constant. With this the basic skills are complete: measuring, calculating, units, uncertainty and relationships.
This video carries audio and subtitles in several languages. Pick yours under the gear icon in the player, at Audio track and at Subtitles.
Physics with Thomas: physics explained with pictures where they add something, and without them where they distract.
In this series
 Quantities and units7:30
 Ratios and percentages3:15
 Scientific notation5:22
 Calculating with powers of ten3:18
 Pythagoras and trigonometry3:19
 Deriving units from a formula7:47
 Significant figures6:24
 Line of best fit5:07
 Relationships and the constant5:20
 Linearising a graph4:41
About me










My name is Thomas Schuurmans, and I have a passion for physics and for understanding why things work the way they do. What I want is to get young people asking “why is that?” and “how does that work?” more often, and to hand them the tools of physics in a way that is simple and that you can see.
I graduated in applied physics at Delft University of Technology in 2003. After that I spent more than twenty years outside education: first at TNO, the Dutch applied research institute, then at a design agency, and eventually founding Proportion Global, through which I work on innovation questions in Africa, Latin America and South Asia. That work resembles physics more than you would expect: don't start from a solution, first understand what is going on, try something, be wrong, and look again.
Since 2026 I have been teaching physics to both lower and upper secondary classes, and I started a master's at the University of Amsterdam for my full teaching qualification. That is where I learned that a secondary school pupil's real attention for new material lasts about seven minutes. And my own weakness happens to be telling too many side stories.
That is where the idea came from: videos that explain one topic sharply and visually, inside those seven minutes. I make them for my own pupils. Then I publish them, because good explanation should be within reach of anyone who needs it, wherever you live and whatever language you think and speak in.